A Different Way To Look At Data
Graph Fundamentals
Suppose that instead of simply storing names, student grades, or other data quantities, you want to store something that represents the reality of transitioning from one point to another. For example, you might be designing the floor layout of a manufacturing facility where some workers are soldering boards, some are loading small parts to be installed by a robotic machine, some workers are packaging the products, and so on. You would want to design an efficient "flow" into the layout so that employees (and robots) are only required to move from station to station with minimal exertion and time consumed.
You are likely to draw out a floor map or graph of the floor where each workstation is at a given location, and is located a certain distance from the next appropriate workstation. The workstations themselves are where the action happens but the paths between workstations are part of the consideration since moving from workstation to workstation itself will end up being part of the manufacturing process.
In graphing terms, each floor station would be a vertex and each path between the workstations would be an edge. Other terms are used for vertices such as points, nodes, or ends, and other terms are used for edges such as paths or links. Graphs are commonly used to represent reality such as bus or airplane routes, or theory such as states of a cellular divide or computing operations. The list of items a graph can model is large, and graphs by the nature of them being "picture-like" many times offer a clearer representation of operations or reality than numbers or other data might.
However, as mentioned above, there is another component of some graphs that extends their abilities to represent a condition. In the example provided, there is a "cost" or "weight" for each transition from workstation to workstation. Not all graphs need this but it adds another potential data component to the condition being modeled. Bus and airplane routes literally experience a cost, in fuel, time, and money flying from one city (vertex) to another (vertex) along a flight route (edge). Again, graphs are pretty good at modeling or representing real or theoretical things.
Graph Types and Examples
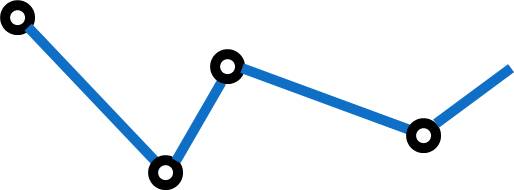
Graphs can come in all shapes and sizes but fundamentally they stay close to the rule of edges and vertices. The simplest of graphs is one that connects points such as the one shown here. This is called a connected graph.
There are graphs that do not connect to all available points. These would be called disconnected graphs and an example is provided here.
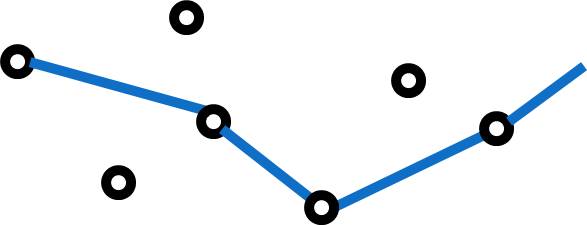
A disconnected graph might represent a condition where certain vertices exist but are not connected since they don't contribute to the model. An example of this would be some smaller towns not served by a given delivery company.
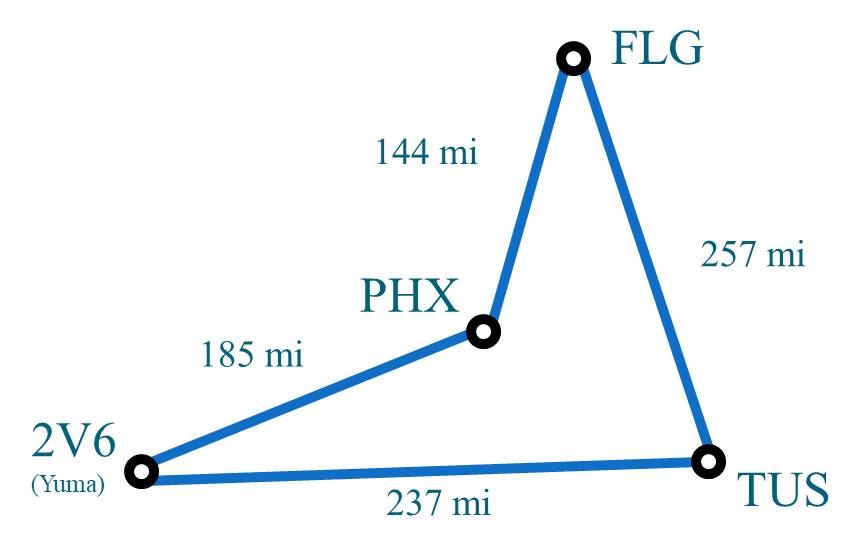
As mentioned previously, some graphs show a cost or weight. An automobile travel map of some towns in Arizona might have the following weights (aka costs).
Also be aware that graphs can have directed components, meaning the graph only goes from a specified vertext to another one in a certain direction.
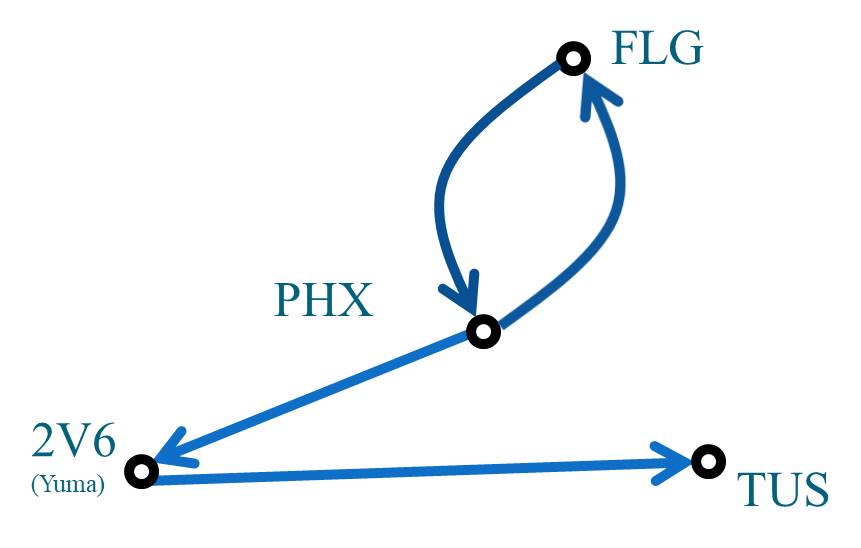
As can be observed with the Phoenix-Flagstaff part of this graph, it is possible to have a graph configured in both directions. Remember that the graph serves the user/programmer who wants to model or represent a reality. It can be configured as needed for any condition.
Graph Data
While graphs are handy at representing themeselves (graphically), there are times when a user just needs the raw data. Consider the following graph.
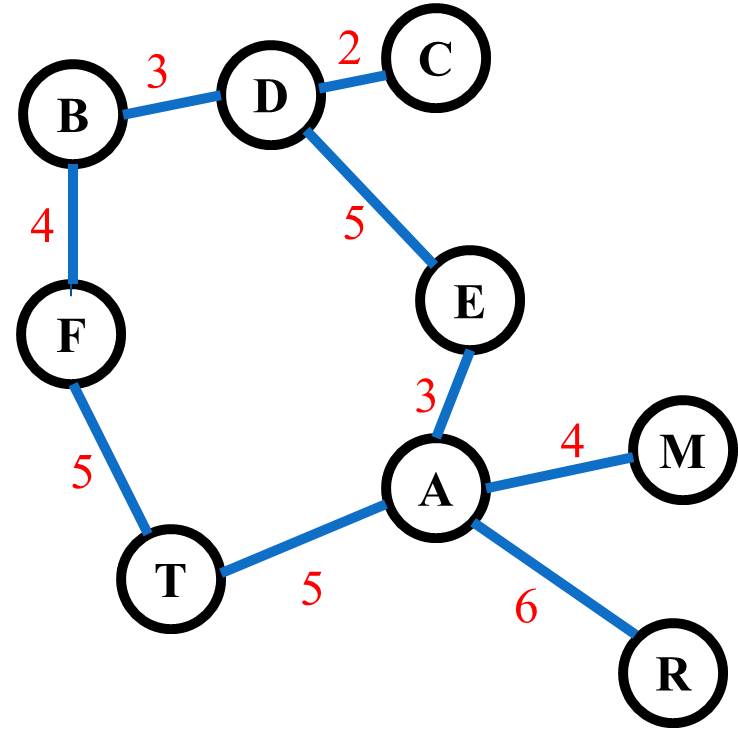
The graph contains quite a bit of data so it might be handy to view the data related to its adjacency information. An adjacency is simply the vertex adjacent to another vertex. This is also called a near neighbor. There are a couple of ways to view adjacency data. One of them is called an adjacency matrix, which is provided here.
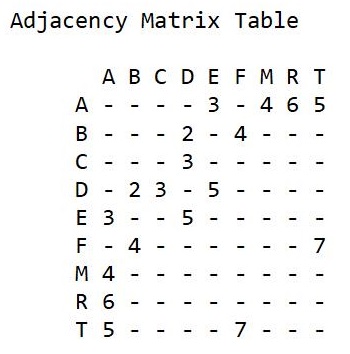
In the adjacency matrix, you can observe the weights between two vertices. Note that from A to E is 3 but as you view E to A, you also get a 3. However, if this were a directed graph, for example from D to E, you would observe the D to E distance (5) but there would be no E to D distance. Again, as a reference, this matrix can be helpful for identifying certain parts of a given graph's data.
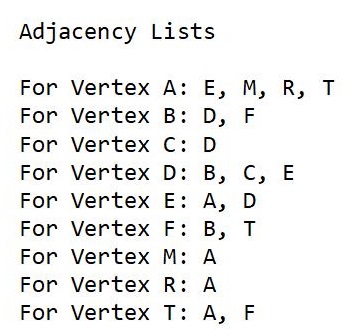
Another data-centered product of a graph is called an adjacency list. The following represents the adjacency list for the previously provided graph.
Graphs, The Summary
You can take classes -- and some of you may have already done this -- and you can pursue whole degrees from Bachelor's to PhD and beyond working with graphs. That is a polite way of saying there is so much more to graphs and graph theory than can be presented here. However, this topic covers the information that will help you understand the fundamentals of graphing and potentially write your own code to model some data.
The next topic will directly address the idea of traversing graphs in one of a couple of ways. And once again, there will be more picture drawing.